Analysis
AI & Data
Spreading in a 17-colour spectral PBMC panel
Seventeen colours do not guarantee seventeen well-resolved readouts. A new PBMC workflow illustrates why spectral similarity, spreading and FMO controls need separate checks before gating dim markers.
Technical Review of a peer-reviewed Methods article, not independent scientific review or clinical validation. Original study: Kiel et al., Frontiers in Immunology (2026).
Standfirst: Seventeen colours do not guarantee seventeen well-resolved readouts. A new PBMC workflow illustrates why spectral similarity, spreading and FMO controls need separate checks before gating dim markers.
Two matrices, two different risks
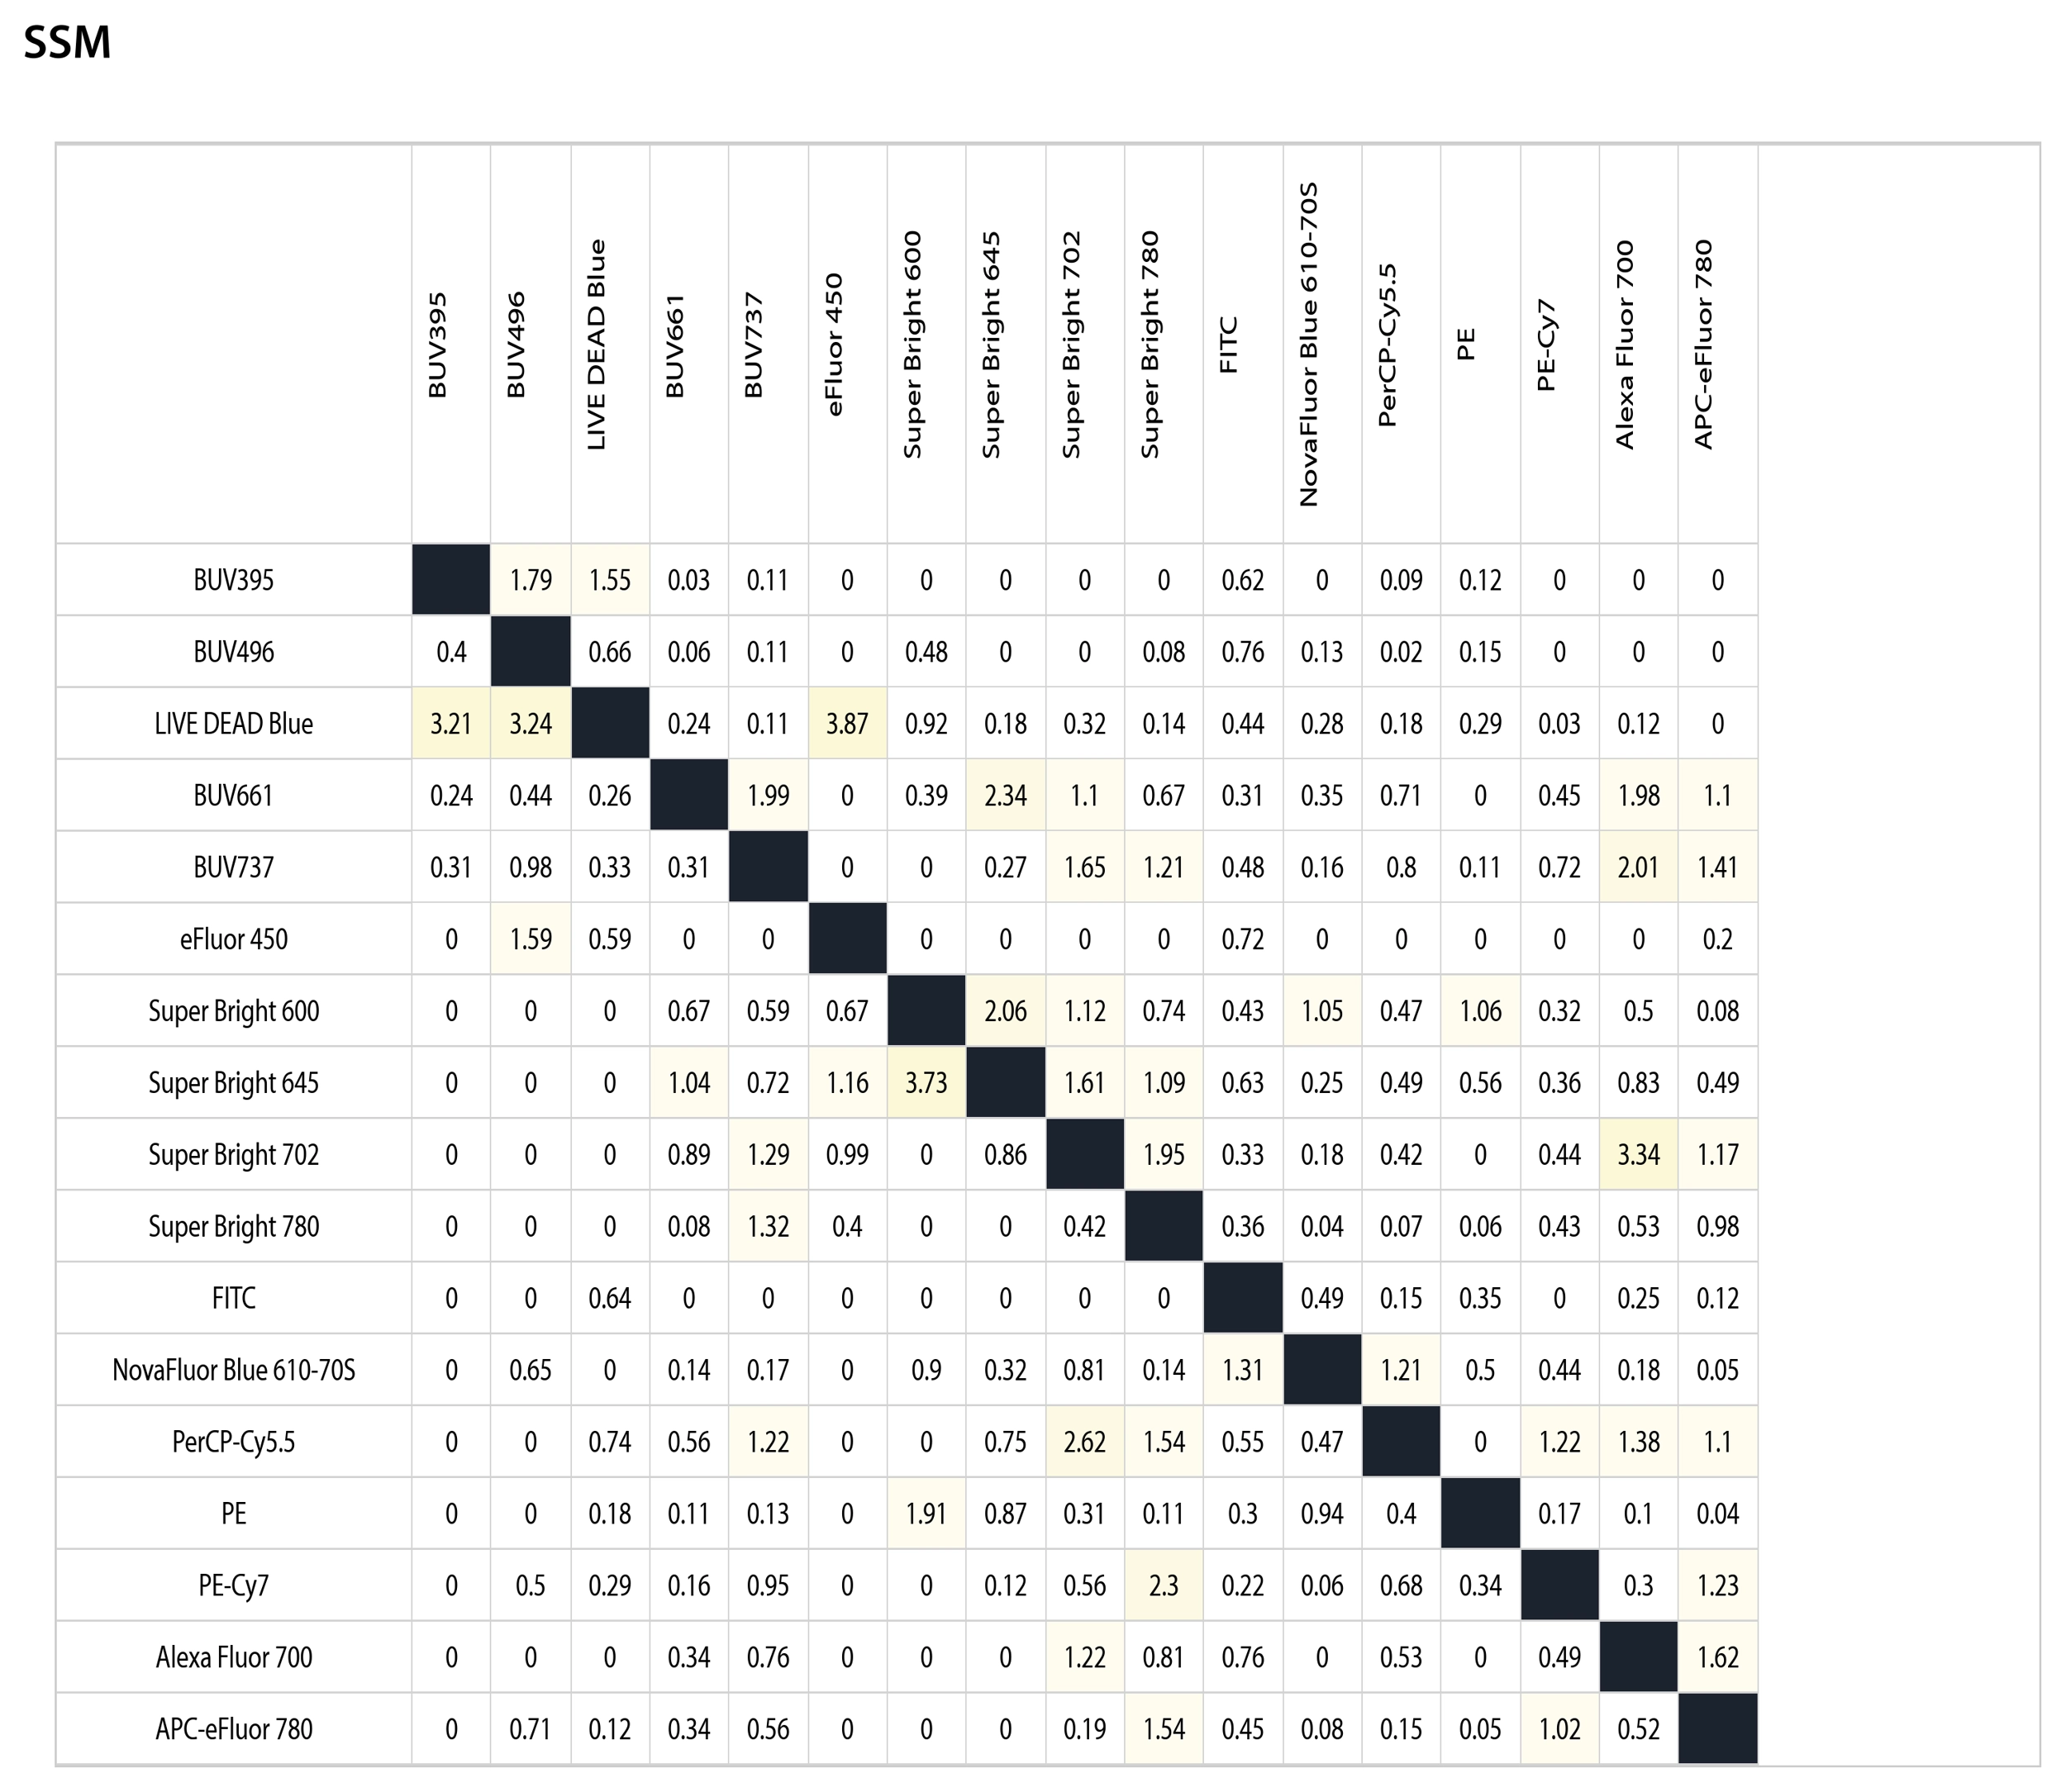
In a spectral cytometer, the similarity index compares fluorescence reference spectra. Closely matching signatures can challenge unmixing. The spillover spreading matrix (SSM) asks a different question: how much a labelled population broadens signal in another channel after unmixing. That broadening becomes most consequential when the receiving channel measures a dim marker. A low similarity value is therefore not, by itself, a demonstration that a dim population is resolvable.
What the 17-colour PBMC workflow actually did
Kiel and colleagues built a single-tube panel covering core PBMC lineages together with activation, regulatory and checkpoint-associated phenotypes. Their five-laser spectral protocol combined antigen-density-aware fluorochrome assignments, antibody titration, single-stained reference controls, autofluorescence extraction and FMO-anchored gates. A cryopreserved, same-donor PBMC reference supported checks across runs. These are interlocking quality controls, not an automatic certification of transfer to another laboratory or clinical assay.
Read the arrow before the magnitude
Figure 6 of the original paper reports, among other assay-specific SSM entries, a spread value of 3.87 from LIVE/DEAD Blue toward eFluor450, 3.73 from Super Bright 645 toward Super Bright 600, and 3.34 from Super Bright 702 toward Alexa Fluor 700. The row-to-column direction matters. Such values are neither percentages nor universal pass/fail thresholds, and they should not be compared uncritically between instruments or panel configurations. They identify where a marker pairing warrants closer scrutiny.
From matrix to gate: the experiment still decides
The study compared fully stained material with matched FMO controls for selected strongly spreading dye combinations. Its results support adequate separation in the tested examples, but no matrix metric substitutes for observing actual negative-to-positive resolution, evaluating lot and sample handling, or checking rare-population event counts. For PD-1, TIM-3 and FoxP3, incoming spread and local background can matter more than how attractive the overall panel similarity matrix looks.
Transferability is a hypothesis to test
The paper's application is translational PBMC phenotyping, including immune–tumour co-culture systems. It does not establish a CE-IVD workflow, clinical diagnostic decision limits or multicentre equivalence. Before transfer, document fluorochrome lots, the exact single-stain controls, tissue or PBMC processing, reference-cell behaviour, FMO gate drift and subset-specific precision. If any of those differ, the published panel is a starting design, not a validated replacement.
Daily Learning Pill
SI describes spectral resemblance; SSM describes signal broadening; FMOs test what the broadening actually does to your gate.
Read the full original Methods paper. For practical training, browse CFCM Resources and Troubleshooting.